Thenextgenerationof
investmentsoftware.

It values companies, builds and tests investment strategies over 15 million historical data points, and researches like an analyst. The whole job, in one place.

An analyst's entire desk. One system.

One AI-native terminal for the whole job. Research any company, listed or private, then value it, build a strategy around it, and prove it on ten years of real data. Every number carries its source.
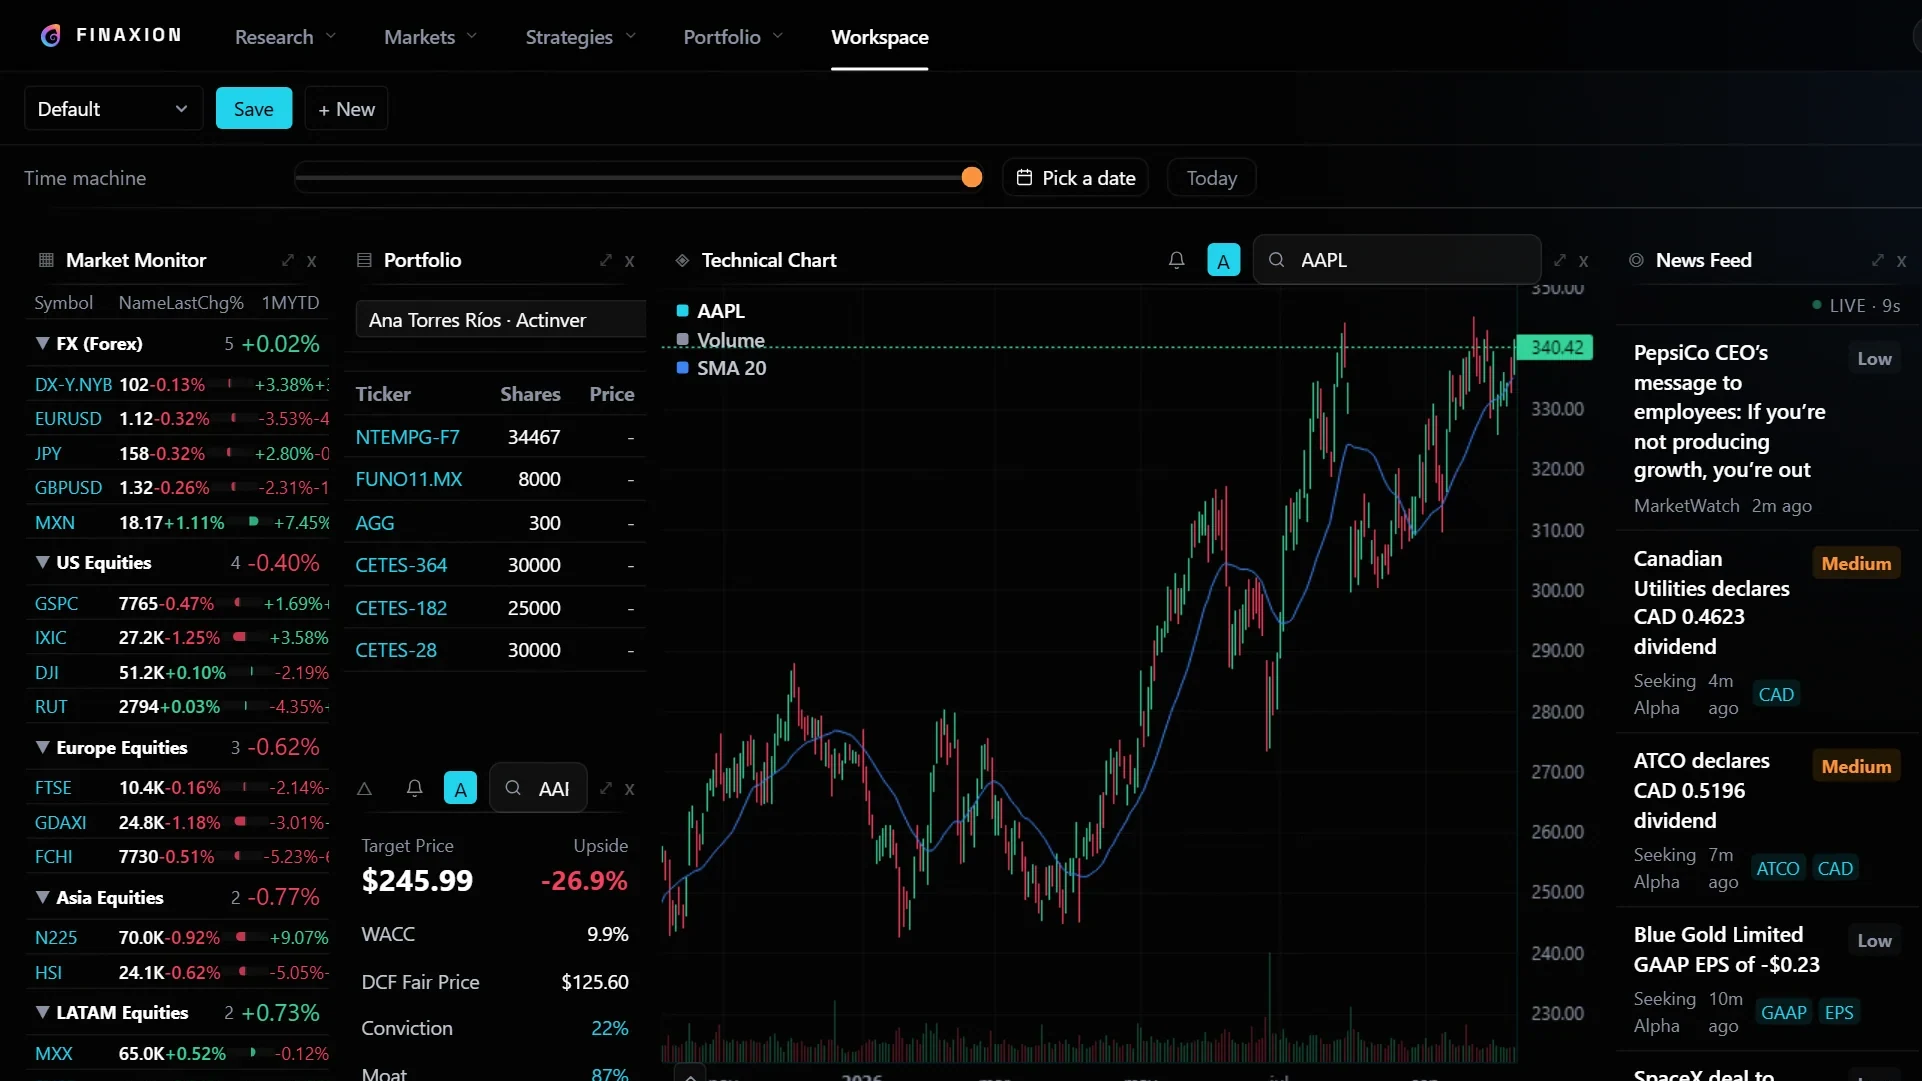
Finaxion workspace — four synced technical charts (AAPL, MSFT, NVDA, SPY) with the time machine
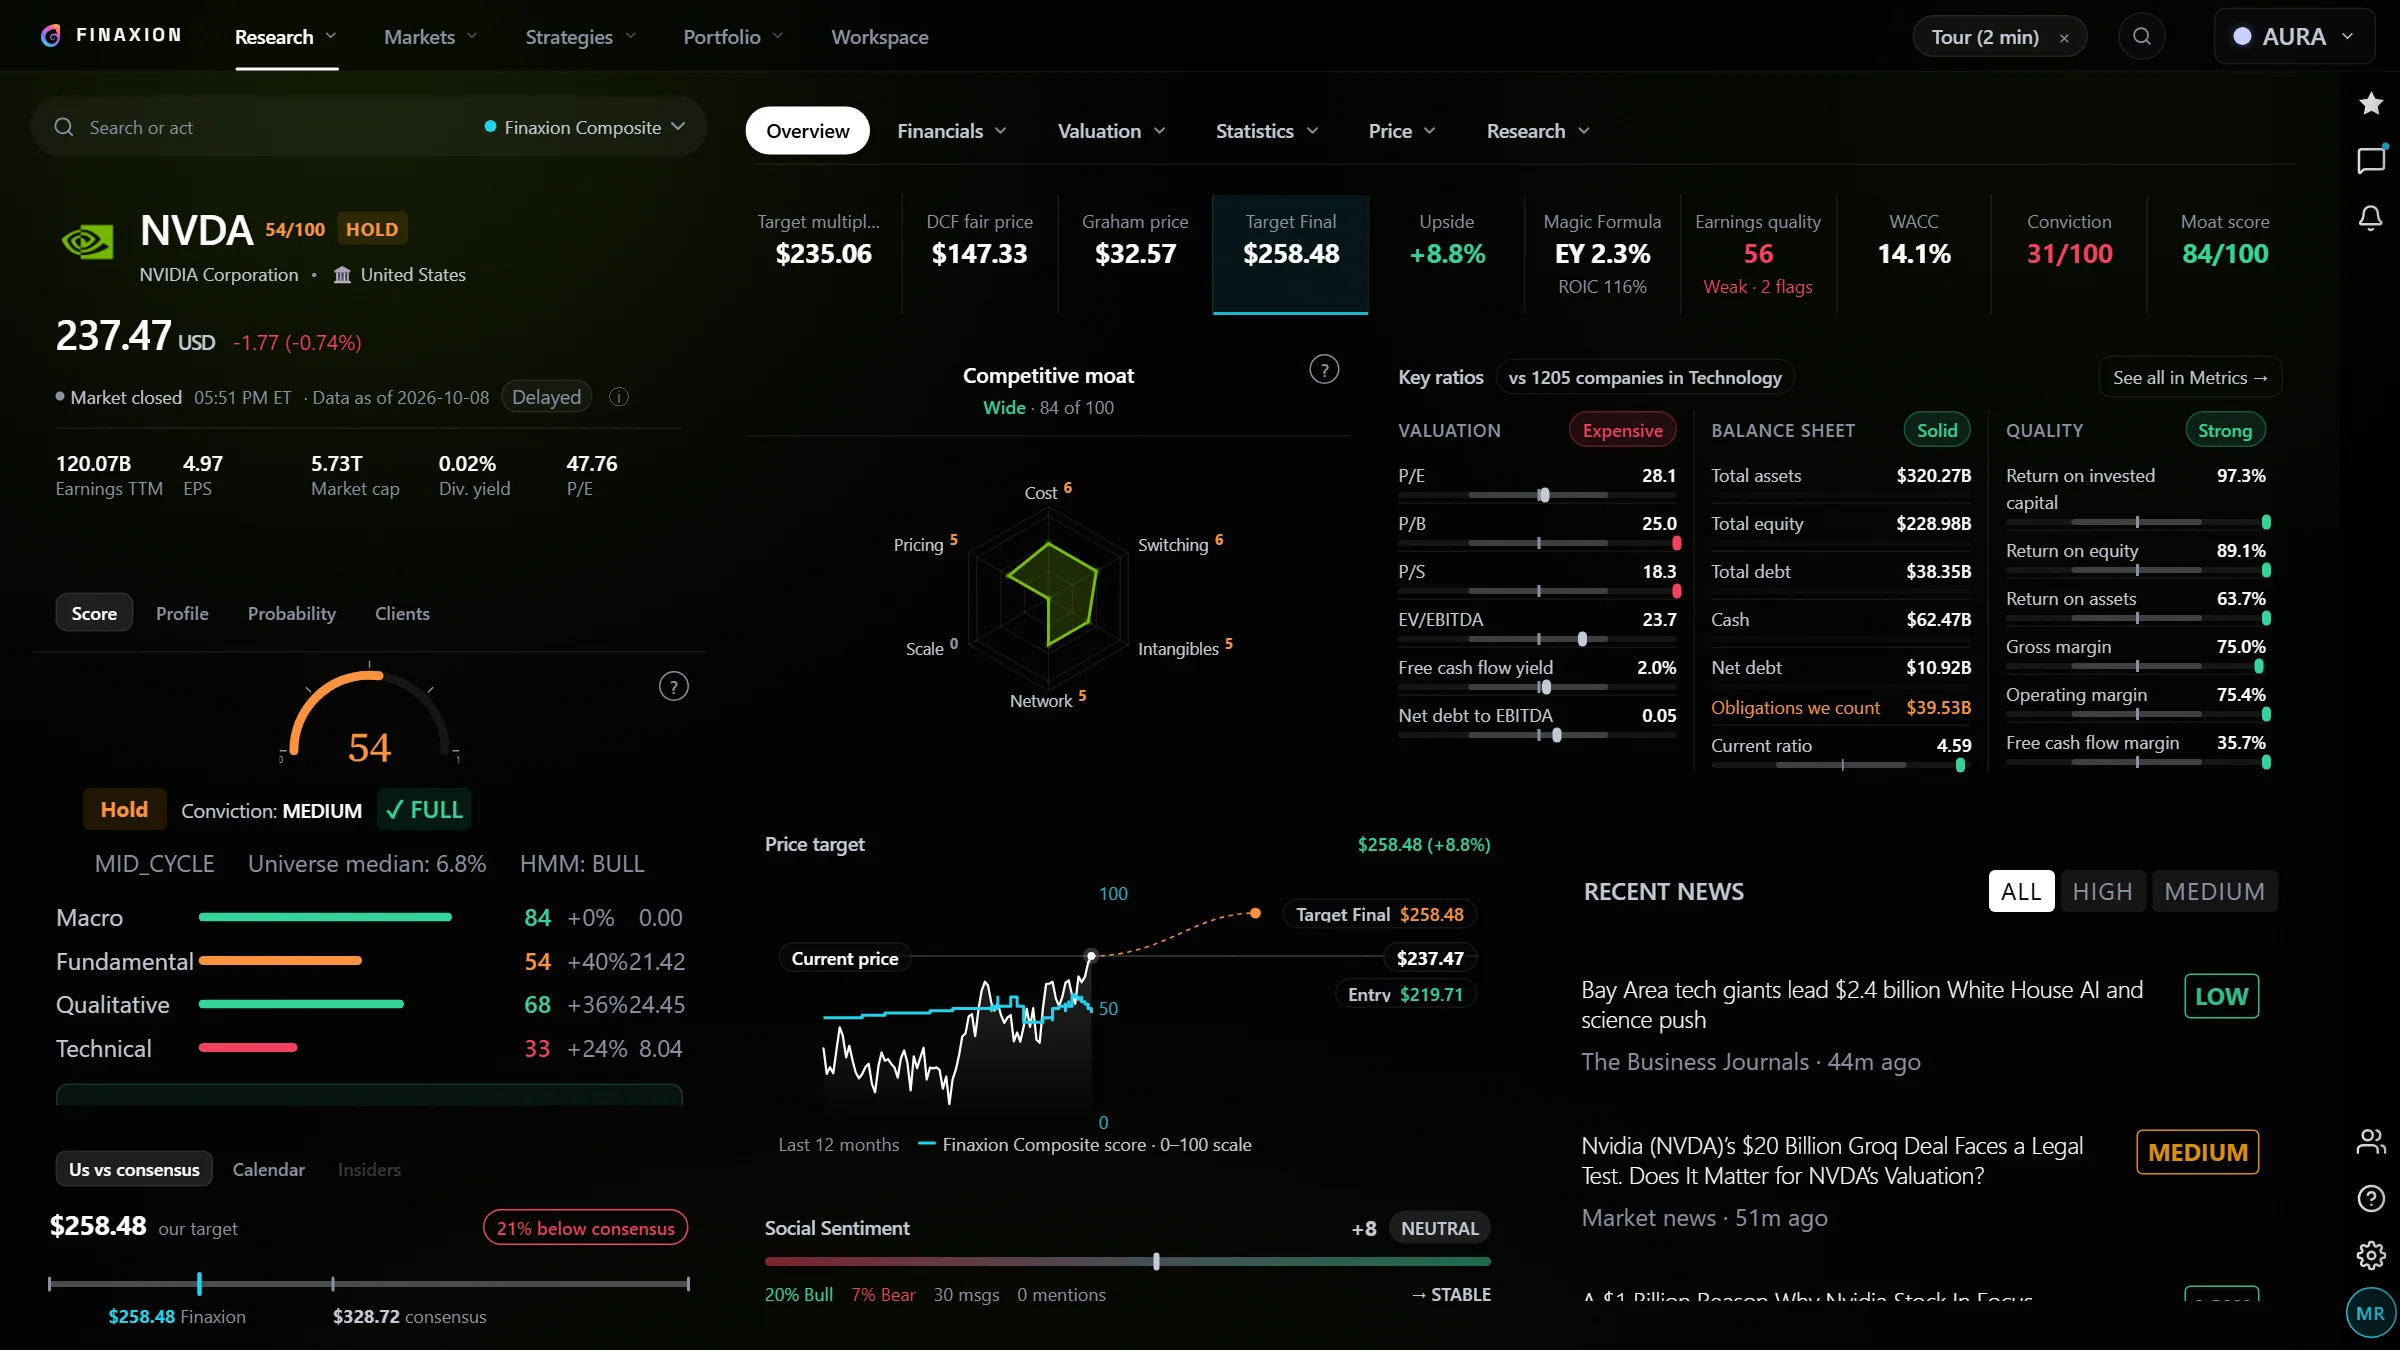
Finaxion company page for NVIDIA with price targets, moat score, key ratios and news
assets
One engine. Three desks.

Prove your edge before you risk a peso.

A live screener across more than 10,000 assets, point-in-time backtesting and a technical ProChart. Describe a thesis in plain language and AXI builds it, tests it over ten years and shows exactly what ran.

🦋 AXI is reading this module…
FOR SERIOUS INVESTORS & TRADERS
◈ Capture pending — not yet available
FOR SERIOUS INVESTORS & TRADERS
SAVE TO: public/shots/v2/screener.webp
Cheap tools. Expensive terminals. AI black boxes.
Here's what none of them do.

Not a black box.

Every figure we give you carries its source. Click it and see the exact line it came from.

NVDA
AAPL
TSLA
AMZN
META
MSFT
Create your own strategy.

With AXI.

Say it the way you would to an analyst. AXI turns the sentence into rules you can read and change.

You

Describe it.

In plain language. No code.

you: "Invest like Buffett, but only in cheap companies with little debt"
✦ AXI PARSED YOUR PHILOSOPHY INTO:
UNIVERSEUS + LATAM equities · 6,238 names
SCREENP/E < 15 · Debt/Equity < 0.5
ENGINEValuation 45% · Quality 35% · Momentum 20%
SELECTIONTop 15 · rebalance quarterly
EDITABLE AS NODES ON THE CANVAS · NOTHING IS A BLACK BOX

Then rewind it. Every decision, date by date.

🦋 AXI is reading this module…
Allocation Time MachineAs of 11/09/2026Daily
Portfolio value
$2,791,210
Return
+179.1%
CAGR
+11.9%
Max DD
-37.4%
Volatility
33.4%
Sharpe
0.76
Alpha vs S&P
+107.1%
INSIGHT■ Mid CycleDrawdown 0.0%▲ GOOGL +3.5%▼ MSFT -14.9%
Equity CurveAttributionHoldings
— Portfolio-- S&P 500■ Early Cycle■ Recession■ Mid Cycle Bull■ Late Cycle■ Mid Cycle
DRAWDOWN0.0%
7 POSITIONSReturnSector
NVIDIA Corporation
NVDA
$193.73
+1.9% · 26%
GOOGL
$295.14
+3.5% · 13%
META
$711.75
+2.4% · 11%
TSLA
$402.52
-7.2% · 8%
Microsoft Corporation
MSFT
$425.26
-14.9% · 21%
AAPL
$274.87
+0.9% · 12%
AMZN
$192.34
-9.6% · 10%
-25%
+25%
✦ AXI · 11/09/2026↻ Ask AXI
Mid-Cycle Rotation Hits Tech
Markets in early February 2026 were digesting a Mid Cycle regime with rates steady and growth moderating. GOOGL outperformed at +3.5% on AI monetization traction, while MSFT lagged at -14.9% as cloud growth decelerated. The -5.7% drawdown reflects a classic rotation out of expensive tech, capping total return at +179.1% from a $2,791,210 base.
11/09/2026 📅

Meet AXI.

CFA-level rigor, the power of your data, and the most advanced AI models. Over 120 skills in one agent.

AXI. Your analyst.
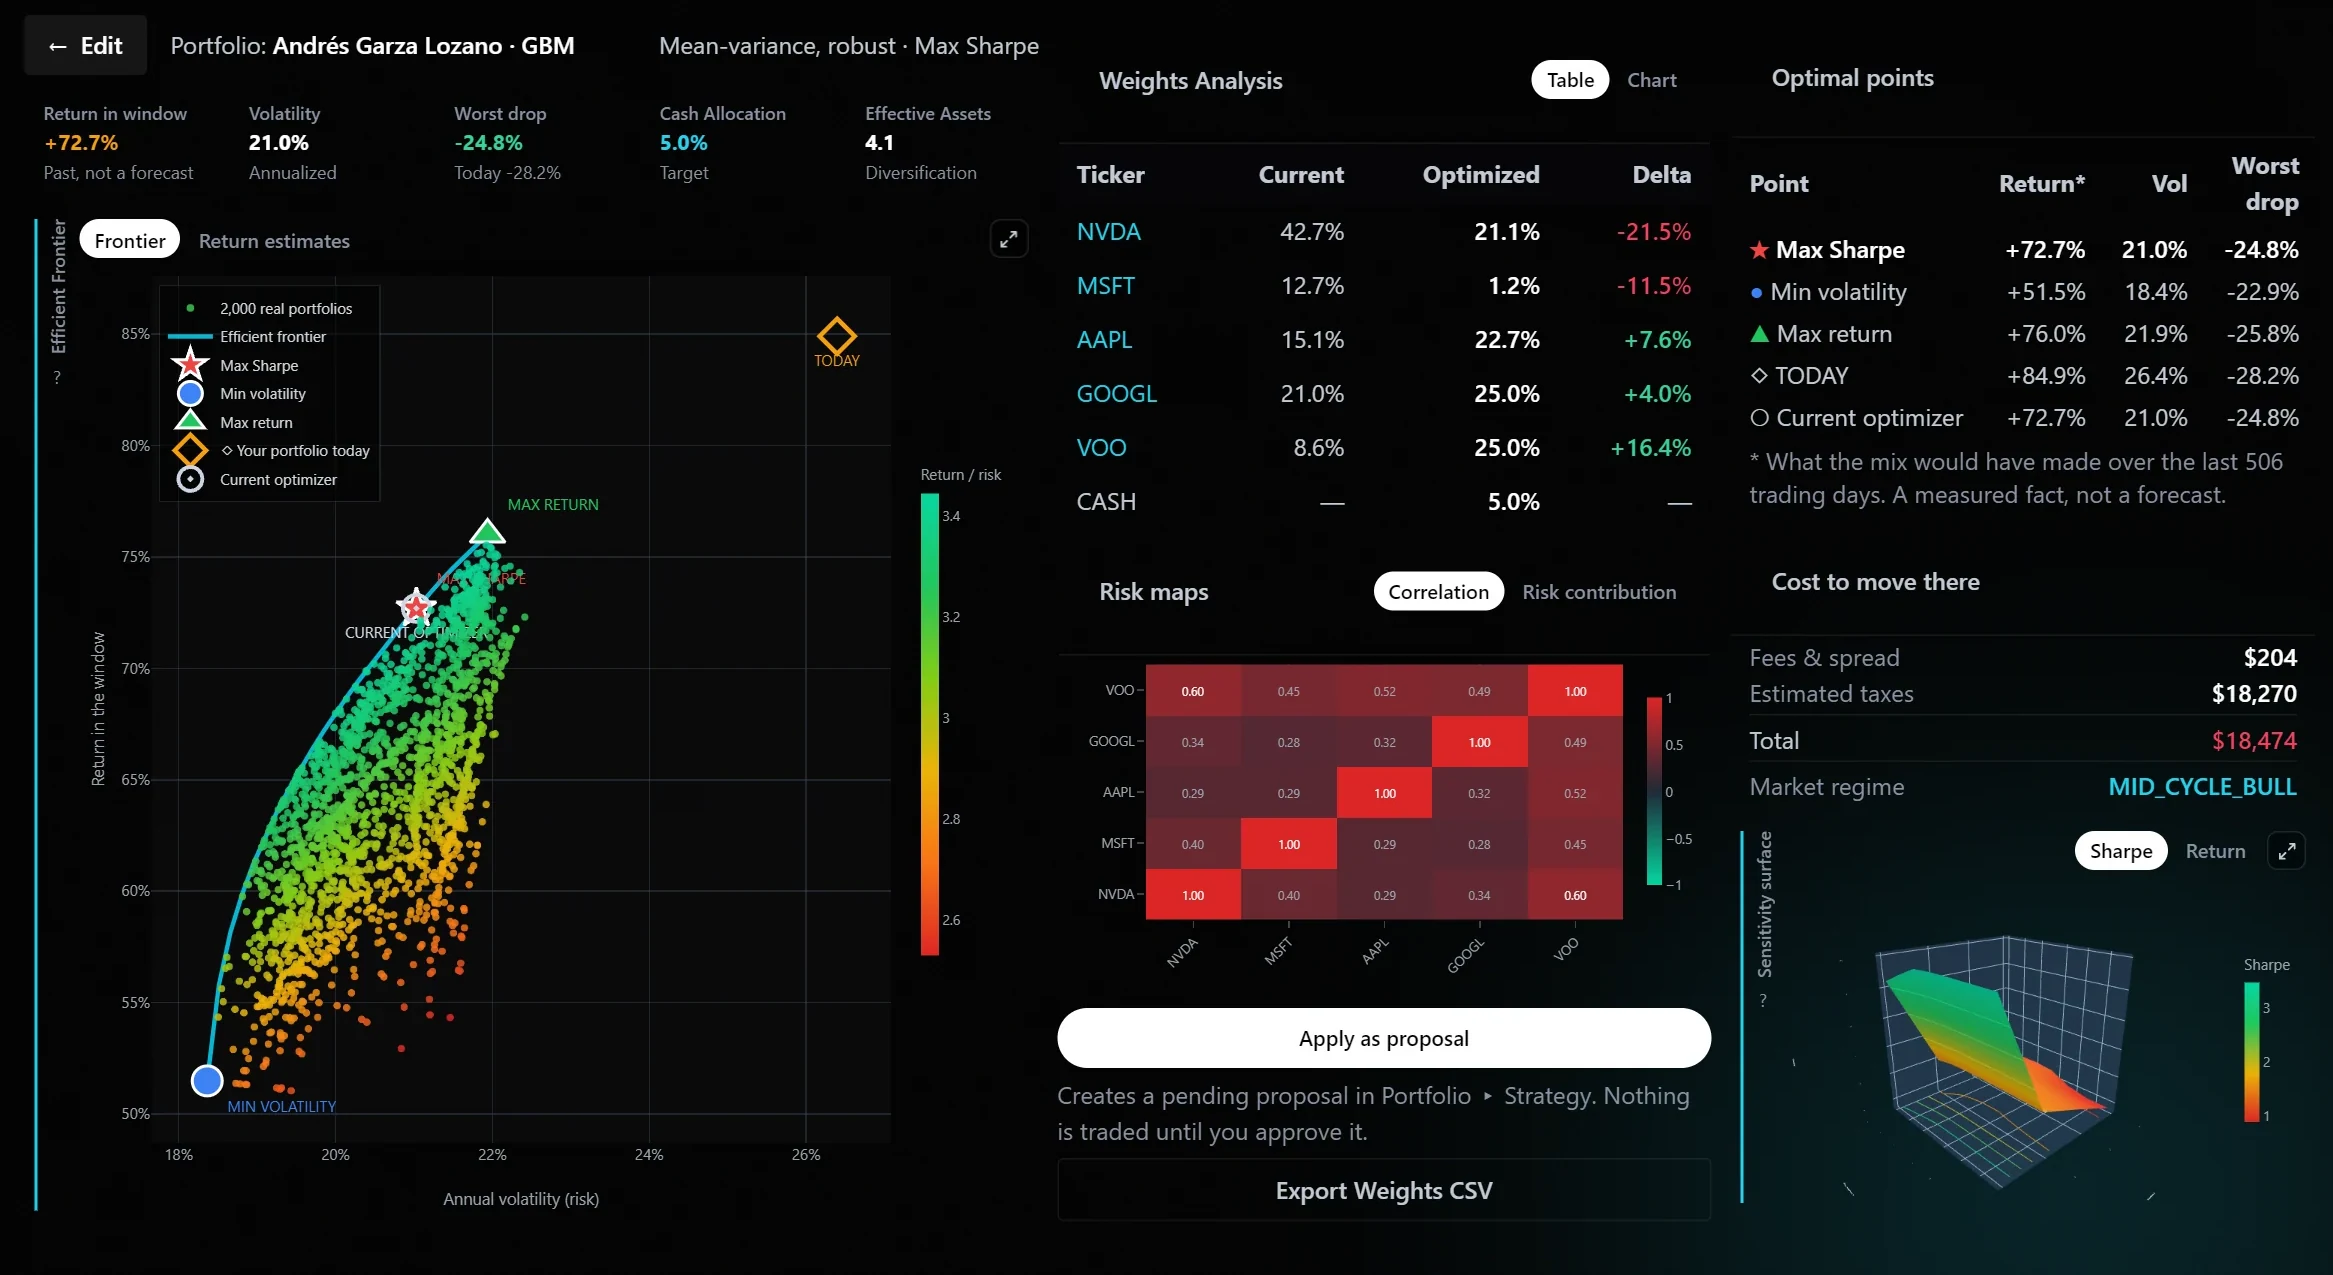
Portfolio optimizer result with efficient frontier, weights, risk map and cost
Efficient frontier1 / 4
2,000 real portfolios built from your holdings. The star is Max Sharpe: +72.7% over the last 506 trading days, measured, not forecast.

The best model, for every task.

Deep reasoning, breadth, speed, scale. AXI routes each request to the frontier model that does that job best. Automatically.

Claude
Claude
GPT
GPT
Grok
Grok
NVIDIA
NVIDIA
Ollama
Ollama
Kimi
Kimi
Get to know AXI. Keep scrolling.
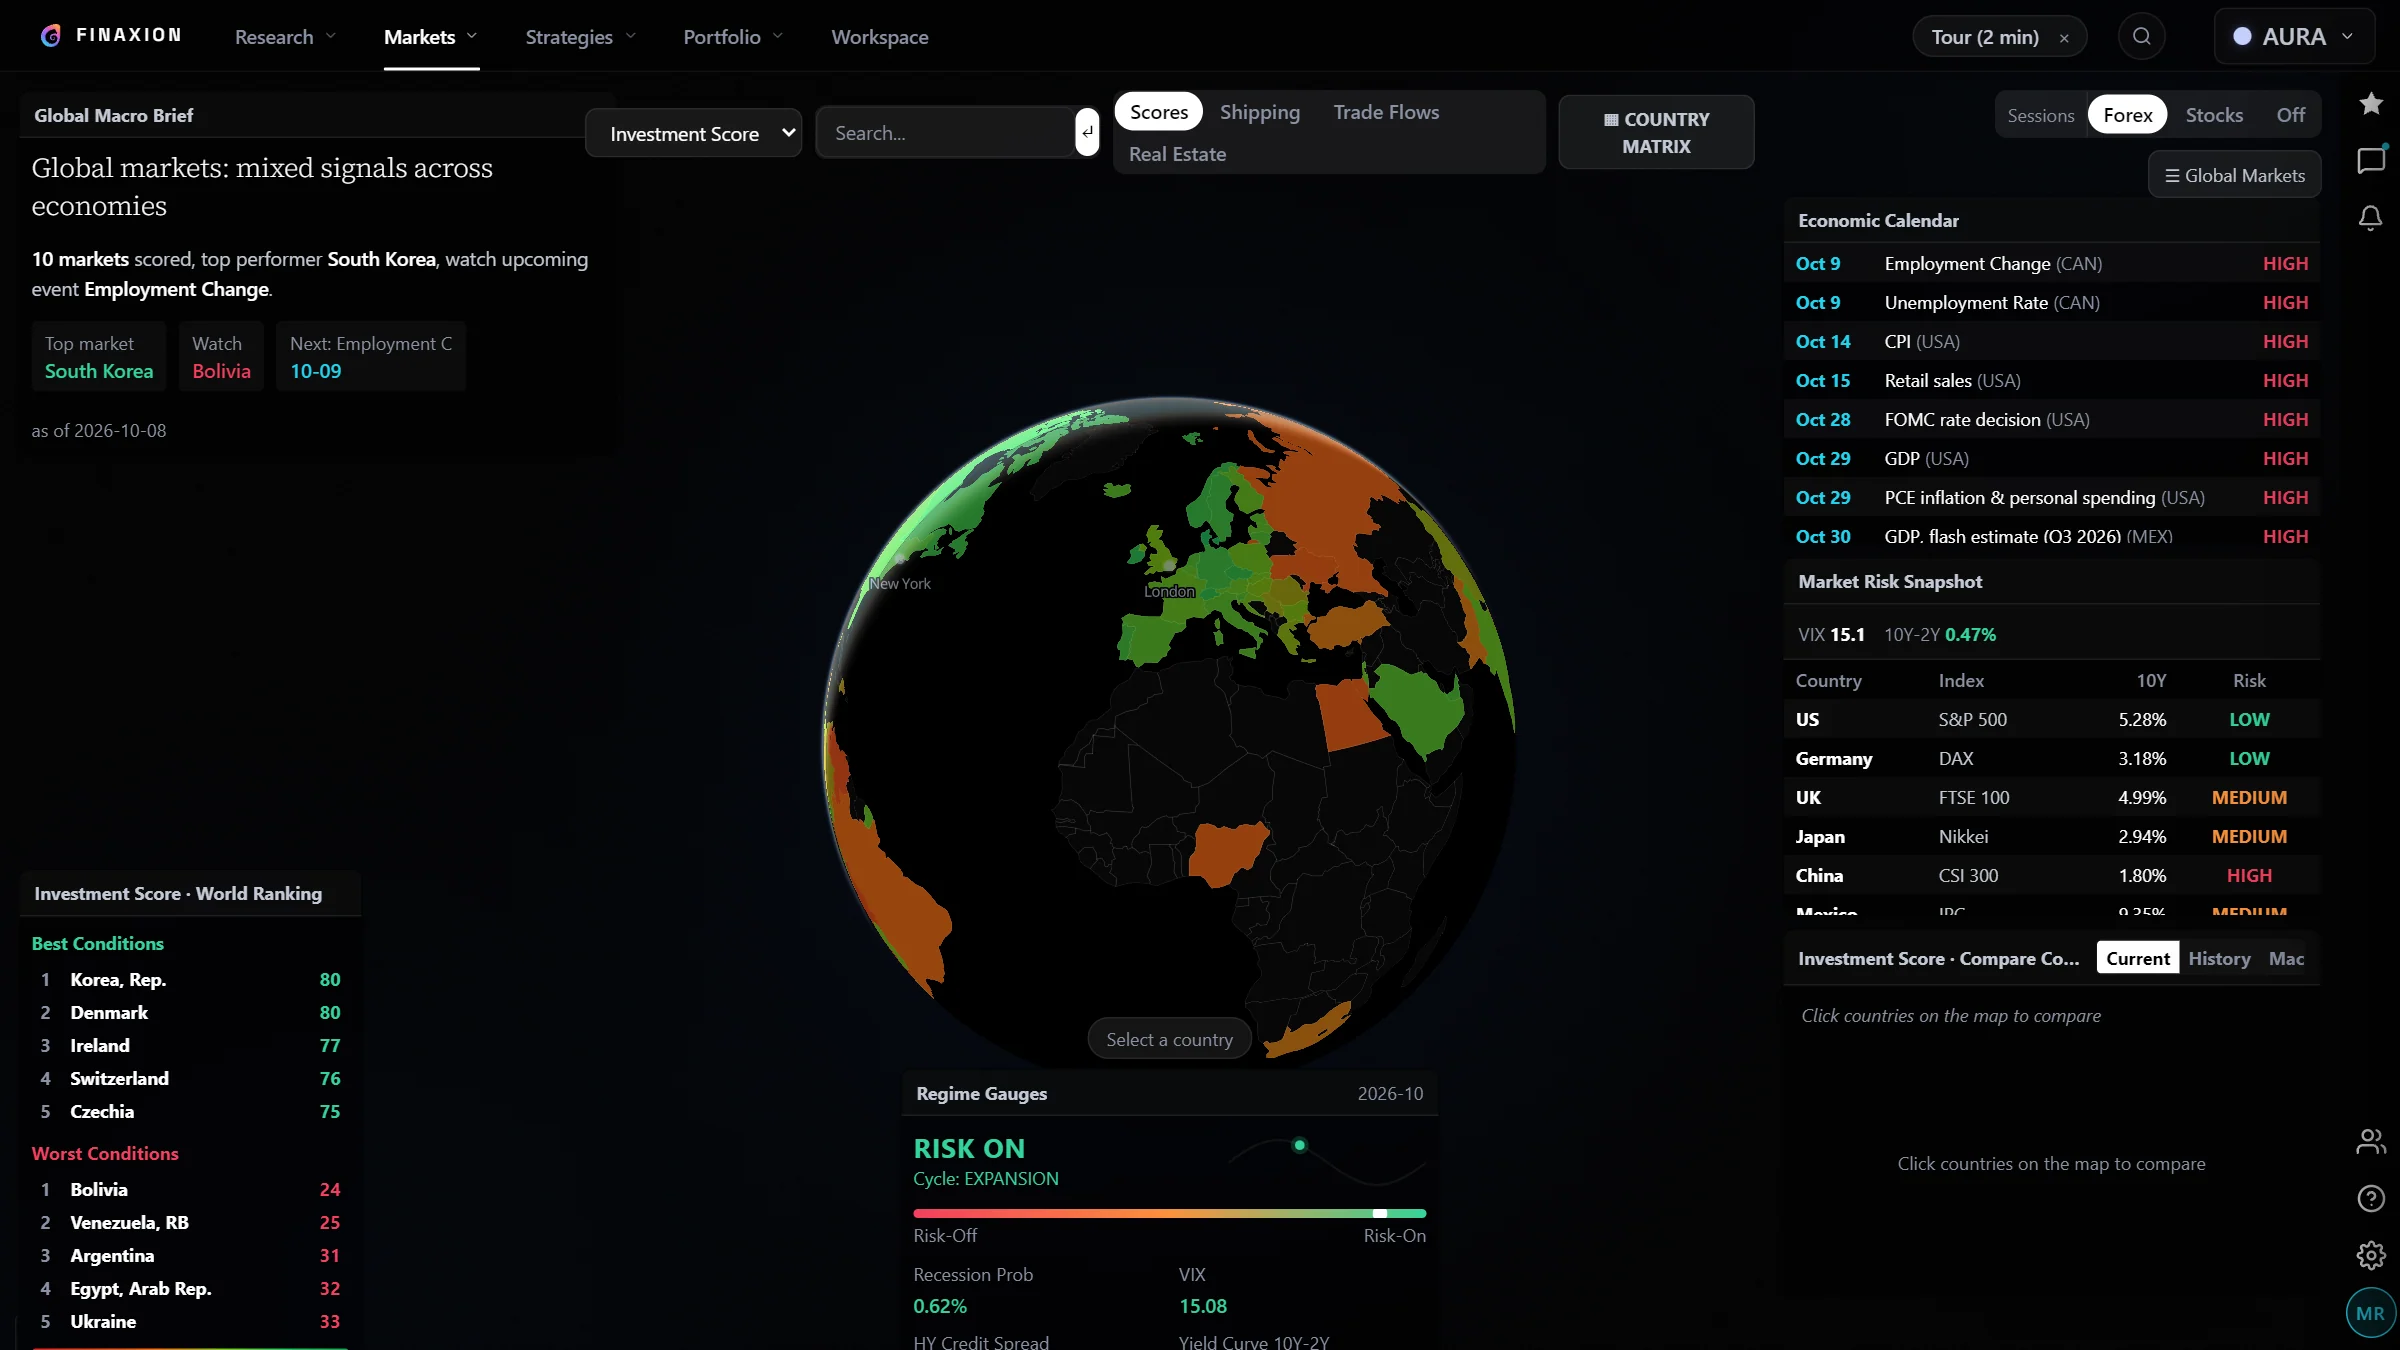
Start from the whole world
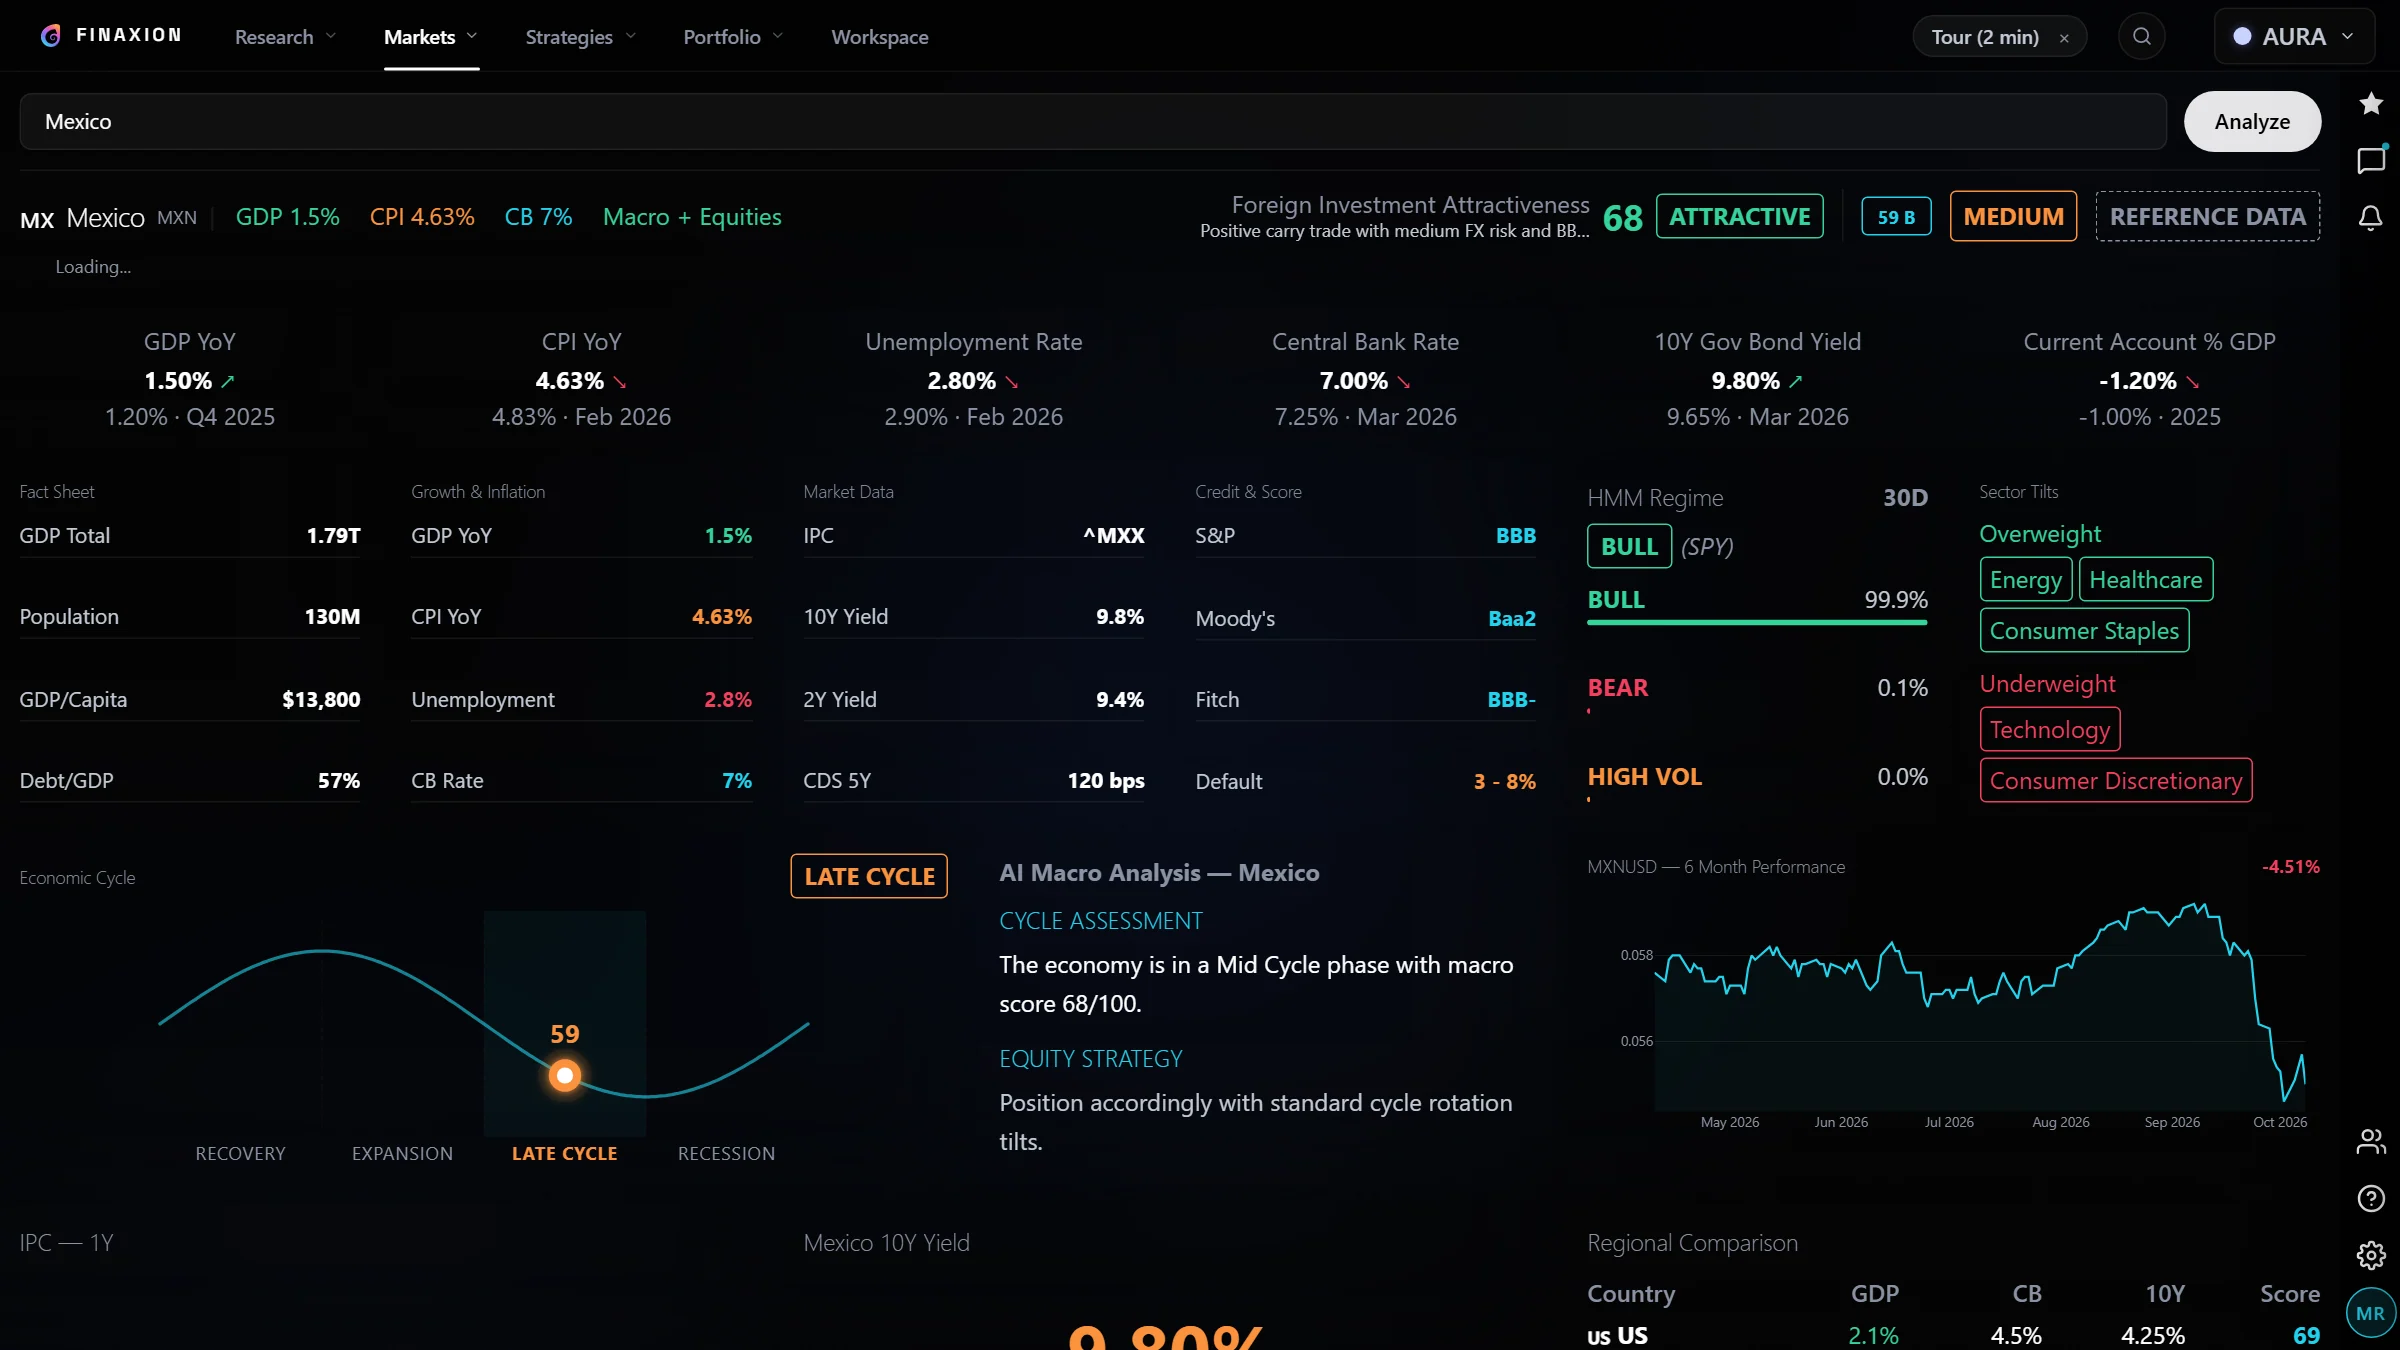
Descend into any economy
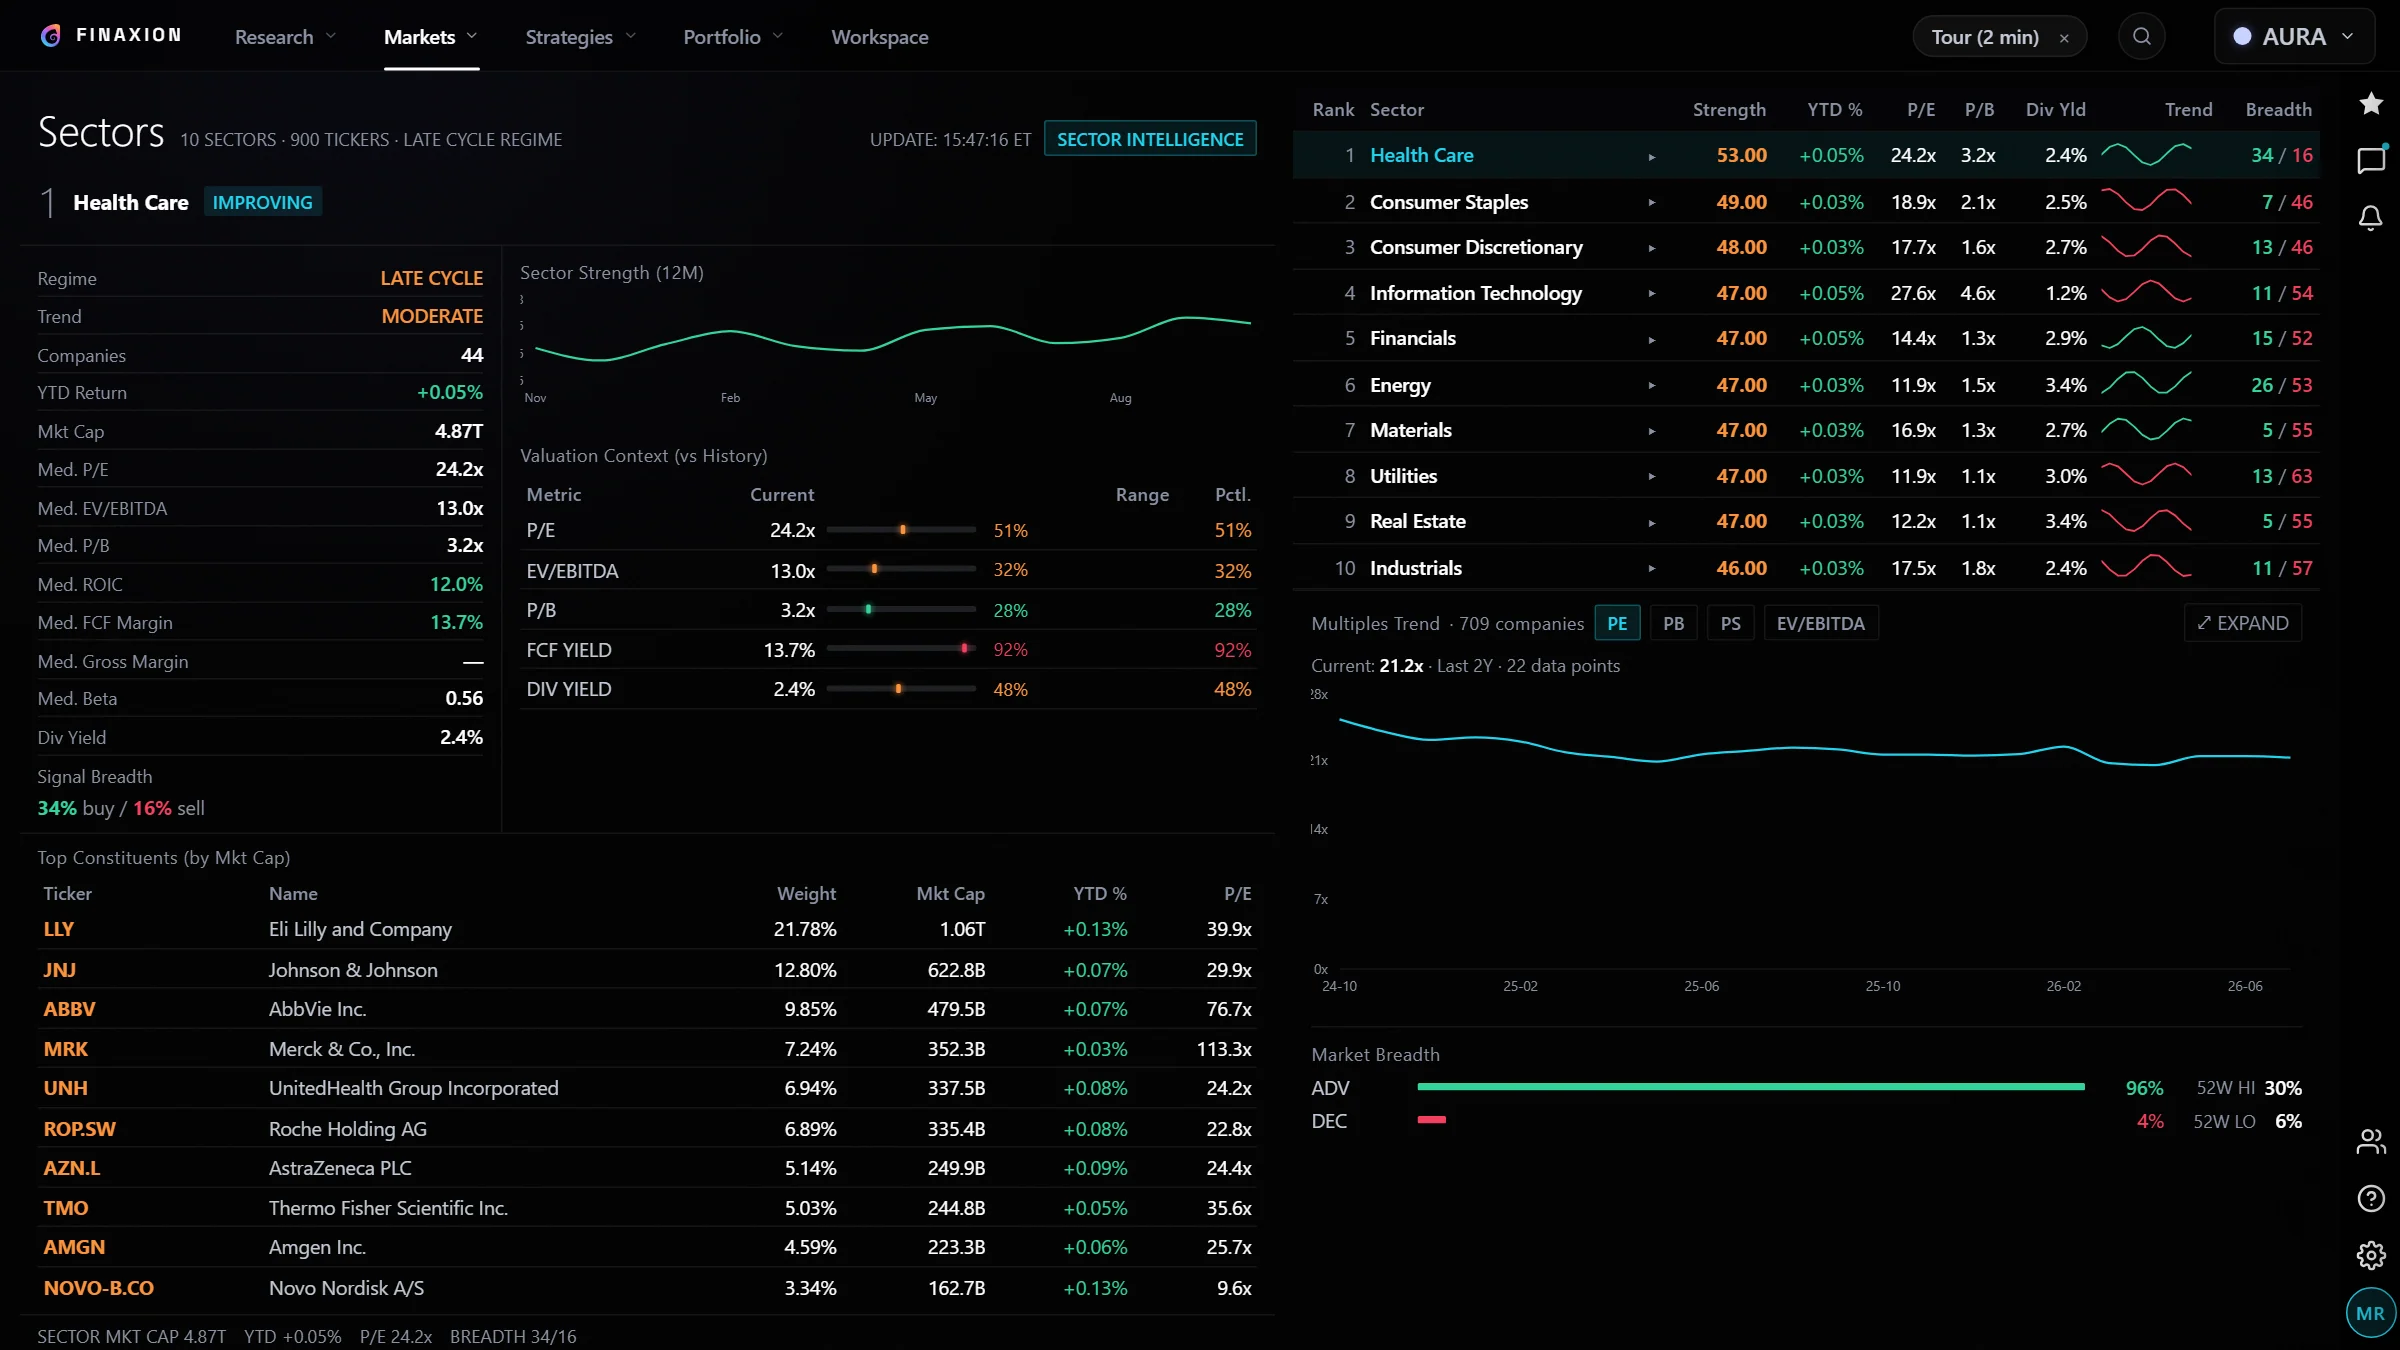
Catch the rotation early
AI SCANNER04
quality compounders under 20× earnings, net cash, LatAm exposure
6,238 SCANNED4 MATCH0.8sP/EROIC1Y
WALMEXWal-Mart de México18.6×24%★ BEST
NET CASH24% ROICLATAM PURE-PLAYAI SCORE 8.1
FMXFEMSA16.9×14%✓ FIT
KOFCoca-Cola FEMSA15.2×16%✓ FIT
GRUMAGruma13.8×18%✓ FIT
MELIMercadoLibre68.4×21%P/E > 20×
ASMLASML Holding31.2×26%NO LATAM
AXI → WALMEX is the widest fit: net cash, 24% ROIC, pure LatAm float
EARNINGS → PRICE · CALENDAR05
EARNINGS CALL · NVDA Q3 FY26 · READ 41s
CEO
“Demand for Blackwell continues to exceed supply — we expect that through next year…”
CFO
“Revenue of $65B ±2%; the outlook excludes China data-center.”
EARNINGS SUMMARY
Revenue$57.0B · +62% YoYBEAT
EPS$1.30 vs $1.25eBEAT
Q4 guide$65B ±2%ABOVE ST.
Data center$51.2B · +66%RECORD
CALL TONE · BULLISH 78% · 128 CLAIMS
EXPECTED PRICE IMPACT
+4.2%CONF 68%
▲Guidance raised above street+2.8%
▲Data-center revenue beat+1.9%
▼China export headwind−0.5%
AI CHARTING06
MSFT· 1DRSIVWAPFIBVOLAXI DRAW ✓$784 +1.8%
AXI · PATTERN
Range compression against resistance — breakout watch, volume confirming.
MONTE CARLO07
PROB. PROFIT
84.8%
PROB. RUIN
0.2%
FINAL RETURN · PCTILES
WORST P5−25.5%
MEDIAN+62.3%
BEST P95+279.2%
SHARPE P50 0.60 · P(>0) 88.6%
SIMULATED EQUITY CONE · 2,000 PATHS · 5Y
DISTRIBUTION OF FINAL RETURNS
DISTRIBUTION OF MAX DRAWDOWN
WALK-FORWARD08
VERDICT
GENERALIZED
WF EFFICIENCY
78%
OOS keeps 78% of IS Sharpe
ROBUST FOLDS
25 / 28
SHARPE IS 1.24 → OOS 0.97
WORST FOLD F22 · −0.21
ANCHORED WINDOWS · TRAIN → TEST (UNSEEN)
IS vs OOS SHARPE · PER FOLD
OOS SHARPE BY FOLD · F1 → F28
Start from the whole world
A live globe of 47 scored markets. See where capital is flowing before you pick a single stock.
Start free trialFinaxion — The next generation of investment software · Beta